These Two Forces Will Decide If Your Local Grocery Store Survives the Next Decade
The uncomfortable economic reality that could flip grocery profitability on its head by 2035


Hello Walton’s Weekly Wramblings Fans! Last week at Groceryshop I had the opportunity to interview Ocado’s CEO Tim Steiner. When it comes to grocery e-commerce, Tim is a pioneer. He co-founded Ocado in 2000, when grocery e-commerce, in particular, was not the sexiest of endeavors, and then spearheaded Ocado’s transformation from a pure-play online supermarket in the U.K. into a provider of end-to-end e-commerce, logistics, and fulfillment solutions for the entire grocery industry, and whose operation also now spans 11 different countries.
For 20 minutes, I got the chance to pick Tim’s brain in front of a packed audience about everything from the lessons he has learned about grocery e-commerce across all these different geographies to the common mistakes he sees grocers make time and time again. But what stood out most from my interview was Tim’s answer to the very last question I posed to him. It is an answer about which I have not stopped thinking ever since.
The Prediction That Stopped the Room
I asked Tim, “How will shopping for groceries 10 years from now be different than it is today?”
Tim’s answer, and I am paraphrasing here, because I was trying to process everything in real-time as he was saying it, was that he believed direct-to-consumer e-grocery would become a more profitable venture than operating traditional grocery stores in or around that time horizon.
Now, as he said this, I could tell the audience was a little skeptical. Having interviewed as many people as I have onstage, you get a sense for what the audience is “feeling.” Never one to go on “feelings,” however, I decided to dig in more to see if my perceptions were correct when the opportunity presented itself.
Two Hands in a Sea of Skeptics
On the last day of the conference, as part of our traditional Omni Talk conference takeaways podcast with the Groceryshop team, that we record right from the stage as the final session track of the show, I asked those in attendance for a show of hands in terms of how many people agreed with Tim’s prediction.
Two people raised their hands.
Two.
Two out of what was likely anywhere between 200 and 500 people (I am a terrible judge of audience size). Therefore, to say my suspicions were correct is an understatement.
But how could this be? How could a visionary pioneer, who has spent the better part of almost three decades honing his skills at grocery e-commerce, have had so few people buying into his vision? Was he just flat out wrong or was the audience too quick to dismiss him?
All of which leads me to today’s Wrambling.
Today’s Wrambling is about forming my own opinion surrounding Tim’s prediction. It is about assessing the probability of whether what Tim said could actually happen, and how the industry should prepare for it, if indeed it does or even could happen. Because, newsflash, there is definitely (spoiler alert) a non-zero chance that Tim Steiner knows exactly what he is talking about.
The Current State Of Grocery Economics
Traditional grocery stores operate on thin margins, but their unit economics remain favorable due to scale, well-understood inventory turns, and relatively predictable costs. According to a recent McKinsey study, the average net margin for a bricks-and-mortar grocery store hovers around 4%, approximately $4 profit per $100 in sales. This margin includes labor costs that represent a substantial portion of expenses but get spread across high volumes of foot traffic and in-store operations.
In contrast, online grocery faces a more challenging baseline. According to that very same McKinsey study, current e-commerce grocery margins often fall into negative territory, marked by losses around -13% per $100 order. This stark difference largely stems from the high variable costs of picking individual orders, packaging, and the much ballyhooed cost of “last mile” delivery logistics. Each step requires labor, transportation, and packaging that multiply the per-item cost beyond the efficiencies of traditional shelf stocking and checkout systems. Or said another way, having the customer act as his or her own picker and last-mile delivery driver can still be pretty profitable, relatively speaking.
All that is, of course, today’s state-of-the-state. We next have to ask ourselves – what else needs to be true to assign probabilities to or to create a timeline around Tim’s prediction?
The Pressure of Labor Costs
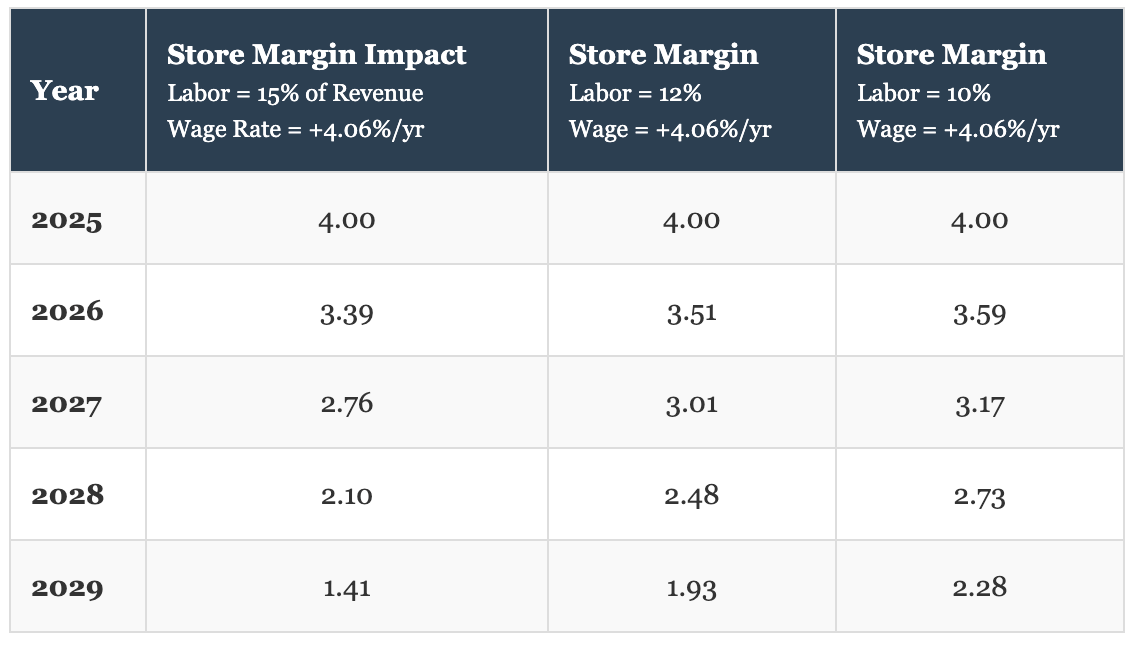
On the store side of the grocery business, one of the most important factors keeping grocery executives up at night is the rising cost of in-store labor. Recent data from Wharton indicates that grocers anticipate a cumulative increase in labor costs of about 22% over the next five years (which equates to an approximately 4.06% CAGR), driven by persistent labor shortages, competitive wage pressures, and inflationary factors. Since labor accounts for a significant overall proportion of in-store operating costs, and roughly 6% to 15% of overall revenue, depending on the grocery operation, this wage inflation could translate into significant margin compression for bricks-and-mortar grocers.
With the help of my new best friend and data gathering and analysis tool, Perplexity, financial modeling, incorporating these labor cost increases, reveals that store margins could decrease substantially due to wage rates by 2029, if all other expenses remain static, and especially if the overall cost of labor as a percentage of the business is also high.
E-Grocery: Margins and Automation
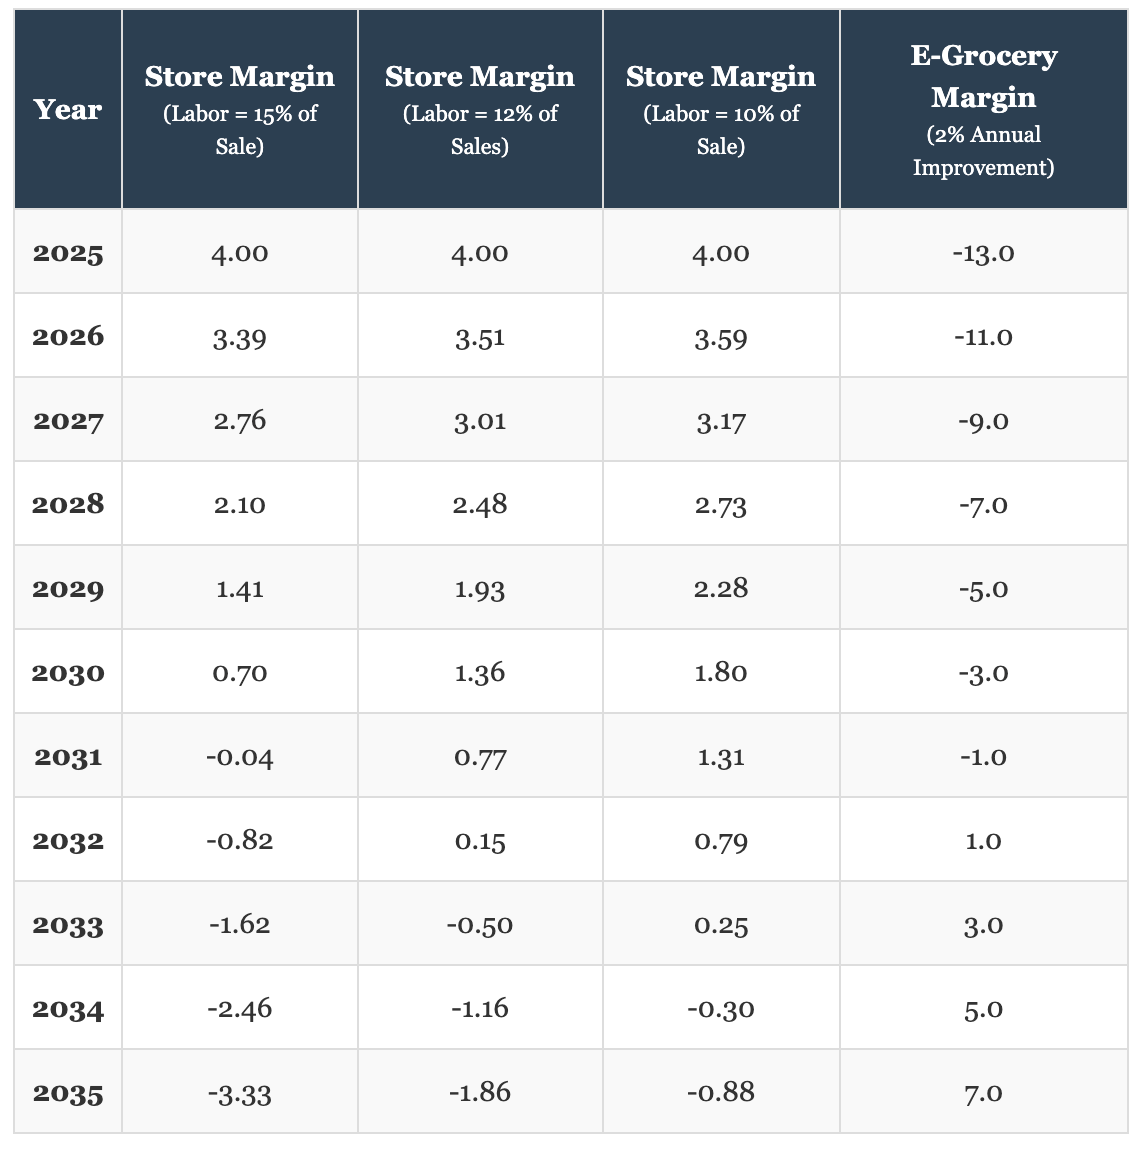
Meanwhile, e-grocery pureplay margins are expected to improve as investments in automation and fulfillment efficiency begin to scale. If one draws an arbitrary line in the sand, for example, of a 2% annual improvement in pureplay e-commerce grocery margins, the inflection point, i.e. when online grocery becomes as or more profitable than in-store, assuming the same 4.06% CAGR, could be reached as soon as 2032 (see below).
Sensitivity to Assumptions
My next questions then are – how realistic are each of these above outlined scenarios and how much sensitivity is there within this estimation? Or, more thought provokingly, does it even matter how right these assumptions are?
For that, I first looked at different assumptions on the projected increases in the cost of labor. Surprisingly, they don’t alter the trajectory all that much. Bringing wage rate growth down from 4% to a much more tempered 2% per year, only moves the inflection point out to year 2033 in some scenarios..
Second, I examined the sensitivity based on the rate of an assumed year-over-year pure play e-grocery margin increase, bringing the assumed rate down to various levels between 0.5% and 2.0%.
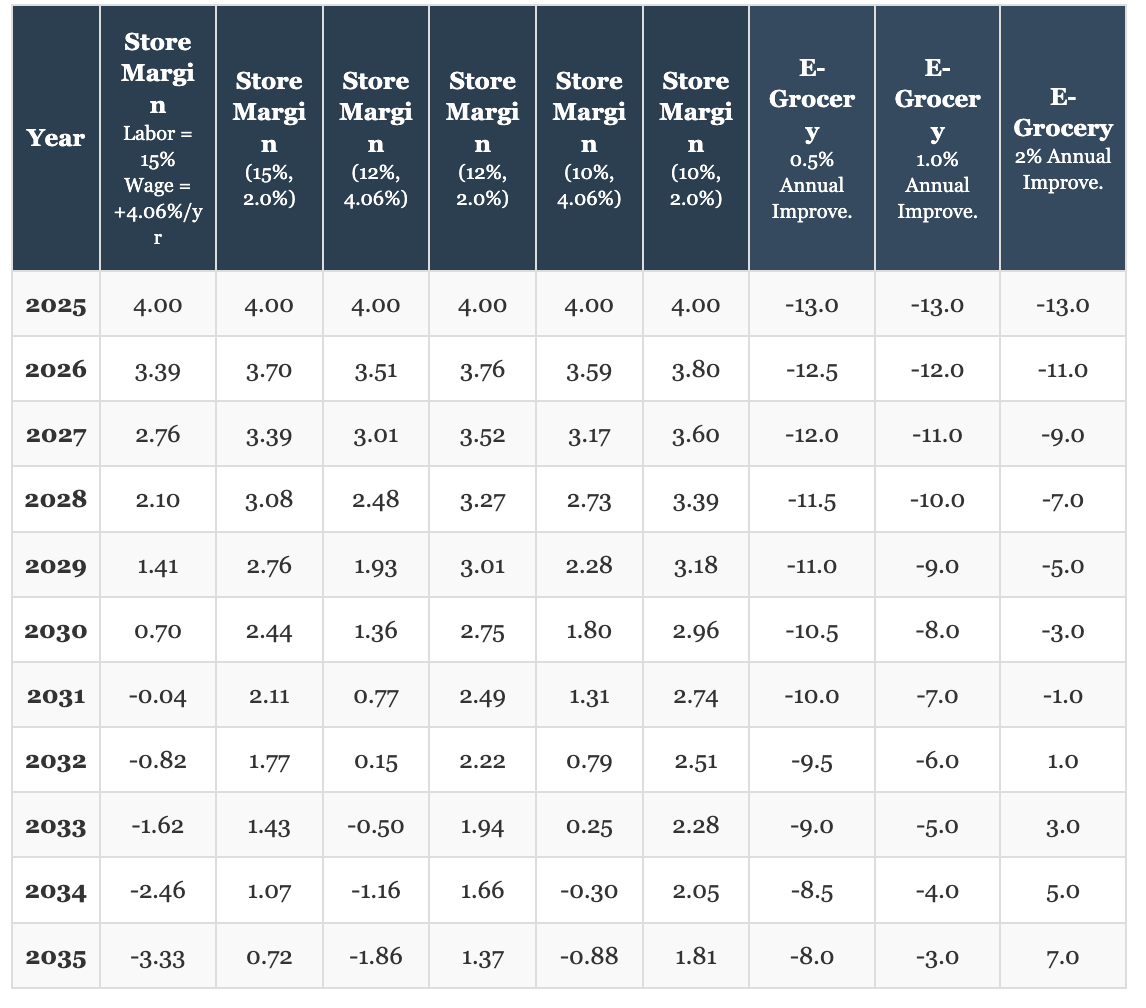
This adjustment does indeed move the profit crossover point further out beyond 10 years, but only if one assumes a much lower rate of wage increase. If the wage rate is assumed to hold at 4% per year for the next 10 years, we could see the inflection point anywhere between 2032 and 2035, if indeed e-grocery also delivers gains in the range of 1% to 2% per year.
The Final Verdict
The idea that e-grocery will sustain little to no increase in productivity and operating margins is highly unlikely. E-grocery has a number of bullets within its chamber that will propel margin gains in the years ahead. For example, any of the below could help to fuel improvements:
Consumer Demand for Convenience – Busy lifestyles and preferences for easy shopping could likely drive sustained online grocery adoption, especially as generative AI makes grocery shopping easier and membership subscriptions, like Walmart+ and Amazon Prime, and others still unnamed or not yet birthed continue to evolve.
Retail Media and Data Monetization – Increasingly, grocery retailers are generating ancillary revenue from their digital platforms by selling advertising, sponsored product placements, and monetizing anonymized shopper data. These revenue streams will continue to offset margin pressures and provide leverage against pure fulfillment costs, and many retailers, particularly in the U.S., are still just getting these platforms off the ground.
Dynamic Pricing and Service Fees – Dynamic pricing online, including delivery or service fees, and optimized promotional spend with personalized offers could further help to drive profitability without eroding margins.
Automation and Micro-Fulfillment – Microfulfillment centers, robotics, and automation solutions to streamline picking and packing, all could also help to drive down the cost of labor and to accelerate order processing.
In a similar vein, given all the macroeconomic pressures of late, it also seems more likely than not that the grocery industry will continue to see the cost of labor rise as well, to a level at least as high or higher than the 20% increase the U.S. grocery industry saw between 2020 and 2024, according to the Bureau of Labor Statistics (an average of 5% of over 4 years).
Too Close to Call, Too Risky to Ignore
Net/net, the final outcome of the race is just too close to call, which in and of itself is important to note. Because the long-term cost to your average grocer from being wrong about dismissing Steiner’s prediction far outweighs the benefits of being right. There is no doubt that Amazon and Walmart will push the envelope on the e-grocery efficiency side of things, and, if you don’t think Amazon is already wise to this idea, then you haven’t been paying close enough attention to the last two months of Amazon’s cavalcade of announcements on the subject.
In the possible event or hedge that Steiner is right, grocery executives would be wise “to take the under” on his prediction and to prioritize their investments in either: a) standing up their own e-grocery fulfillment operations and/or b) driving productivity and efficiency in their stores.
In layman’s terms, that means putting intelligent store management tech over smart carts, placing retail media investments ahead of HQ tools, HR recruiting and retention efforts ahead of fancy e-commerce frills, and prioritizing building your own direct-to-consumer e-commerce infrastructures over leveraging third-party marketplace platforms, like Instacart and UberEats, that take your first-party data and make it almost impossible to find efficiencies in your own fulfillment efforts.
At this point in e-grocery’s evolution, one could even argue that the over reliance on third-party platforms may even be just mucking everything up – which will become more evident as we watch Kroger’s story, particularly, play out over the next decade – but that is another article, for another day.
Don’t Dismiss the Disruption
Finally, while I am sure there are many people reading this article, who will try to tear apart the modeling above and try to throw shade in my direction, there are way too many things that could break in any number of directions that make dismissing Steiner too risky.
And, If that is you, you are also missing the main point here.
Whether the modeling I was able to do in the span of 72 hours with Perplexity is right or wrong doesn’t really matter (and feel free to check out the appendix, if you are really curious). What matters is engrossing oneself in the discussion.
The main point of this article is that it is wrong to dismiss Tim Steiner’s prediction summarily. It is quite possible that Tim Steiner’s prediction could happen, and if it does, it will happen because of two dynamics: 1) The rising cost of labor 2) The continued efficiency gains of e-grocery.
When the inflection point happens or if it does is actually moot. Both these factors will outsizably impact the next ten years of grocery retailing, and we should expect the wisest regional grocers, over that same period of time, either to start cashing out and harvesting their value now by looking to acquire others or to be acquired themselves, while those less shrewd, those less clairvoyant, will keep fighting the good fight, believing that they keep a present day mindset and don’t need to focus on these dynamics, and thus risk finding themselves left holding a very non-saleable bag.
Grocery is by no means easy, but, by the same token, if the past 20 years of e-commerce have taught us anything, it is that getting to “easy” is what drives innovation. AI, robotics, the inertia of not wanting to get up from the couch, all make things easier.
The future is never now.
Appendix: Detailed Calculation Methodology for Sensitivity Analysis
This appendix documents the step-by-step calculations used for the store margin and e-grocery margin scenarios shown in the used tables. All calculations begin with a 2025 baseline and apply annual wage inflation and compounding assumptions for a variety of labor cost shares. E-grocery scenarios use simple year-over-year incremental improvements.
1. Store Net Margin Model: Definitions and Formula
Store net margin for each scenario is calculated by subtracting labor and non-labor costs from revenue, then dividing by revenue:
\text{Net Margin (6)} = \frac{\text{Revenue} - (\text{Labor Cost} + \text{Other Costs})}{\text{Revenue}} \times 100
All scenarios assume constant non-labor/other costs for clarity. Labor costs rise annually according to the scenario assumptions.
2. Labor Cost Share and Annual Inflation
Labor cost share: Percent of revenue (10%, 12%, 15%)
Annual wage inflation:
Higher scenario: 4.06% compounded per year (so that cumulative increase is 22% over 5 years)
Lower scenario: 2.0% compounded per year
Calculation of Labor Cost by Year
For year t t,
Labor Costt=Labor Share×Revenuet×(1+r)t−2025
Labor Cost
t
=Labor Share×Revenue
t
×(1+r)
t−2025
Where
r
r is the annual wage inflation rate (0.0406 or 0.020)
Revenuet=100
Revenue
t
=100 (normalized for modeling purposes)
3. Annual Net Margin Calculation
For each year:
Calculate labor cost with compounding:
Labort=Labor Share×(1+r)t−2025×Revenue
Labor
t
=Labor Share×(1+r)
t−2025
×Revenue
Non-labor costs =
Revenue−Labor Costbaseline−Net Marginbaseline
Revenue−Labor Cost
baseline
−Net Margin
baseline
Example: For a 15% labor share in 2025, other costs = 100 - 15 - 4 = 81
Net Income =
100−Labort−Other Costs
100−Labor
t
−Other Costs
Net Margin (%) =
Net Income100
100
Net Income
4. Example Calculation for 2025 and 2026
2025 (Baseline):
Labor cost:
15
15 (for 15%),
12
12 (for 12%),
10
10 (for 10%)
Other costs:
81
81,
84
84,
86
86
Net Income:
100−Labor−Other Costs=4
100−Labor−Other Costs=4
Net Margin:
4/100=4.00
4/100=4.00
2026, 15% labor share, 4.06% growth:
Labor:
15×1.0406=15.609
15×1.0406=15.609
Other costs: 81
Net Income:
100−15.609−81=3.391
100−15.609−81=3.391
Net Margin:
3.391
3.391
2026, 15% labor share, 2% growth:
Labor:
15×1.02=15.3
15×1.02=15.3
Other costs: 81
Net Income:
100−15.3−81=3.7
100−15.3−81=3.7
Net Margin:
3.70
3.70
Repeat for all years using compounded labor cost increase:
Labor (t) = LaborShare x (1 + InflationRate)^(t - 2025) x Revenue
Other costs = constant from baseline year
Net Income = Revenue - Labor(t) - Other costs
Net Margin (%) = Net Income / Revenue
5. E-Grocery Margin Calculation
E-grocery scenarios model simple annual incremental improvements from a baseline -13% in 2025:
0% improvement: stays at -13% per year.
0.5% improvement: each year, margin increases by 0.5%.
1% improvement: each year, margin increases by 1%.
2% improvement: each year, margin increases by 2%.
Example (1% improvement):
E-Groc Margint=−13+1×(t−2025)
E-Groc Margin
t
=−13+1×(t−2025)
So, 2026: -12%, 2027: -11%, etc.
6. Summary Table Construction
Each column is computed for each labor share and wage inflation rate using the formula above, with e-grocery margin scenarios computed independently as linear increases.
7. Replicating/Adapting the Model
Build a table/spreadsheet with columns for each labor scenario and e-commerce scenario.
Apply the formulas above for each year.
Adjust labor share, wage inflation rate, or e-grocery improvement rate as needed to generate alternative scenarios.
8. Assumptions & Limitations
Revenue is kept constant for all calculations for clarity and focus on expense-driven margin compression.
All other costs outside labor are held static.
This model does not incorporate non-labor cost inflation, sales growth/decline, or tax impacts; for strategic analysis, these can be added.
9. Sources
[McKinsey Grocery Store Profitability Study]
[Wharton Labor Cost Increase Data]
[Standard Net Margin Accounting Formulas]